Matthias Nehlsen
Software, Data, and Stuff
D3.js and Play Framework: Getting Started
Data without visualization is dull. This is particularly true for changing data. We seem to be much better at noticing moving things than we are at noticing changes between spreadsheet cells or other text. That's okay. I'm actually a big fan of that. Text does not usually threaten to run me over when I attempt to cross a street. So let's create moving things with D3.js and drive the animation reactively with data from a server written in Scala using the Play Framework.
In the last article I have introduced sse-perf, a load testing tool for Server Sent Event (SSE) streams. With that tool I gather data that I want to present in the browser using animated barcharts:
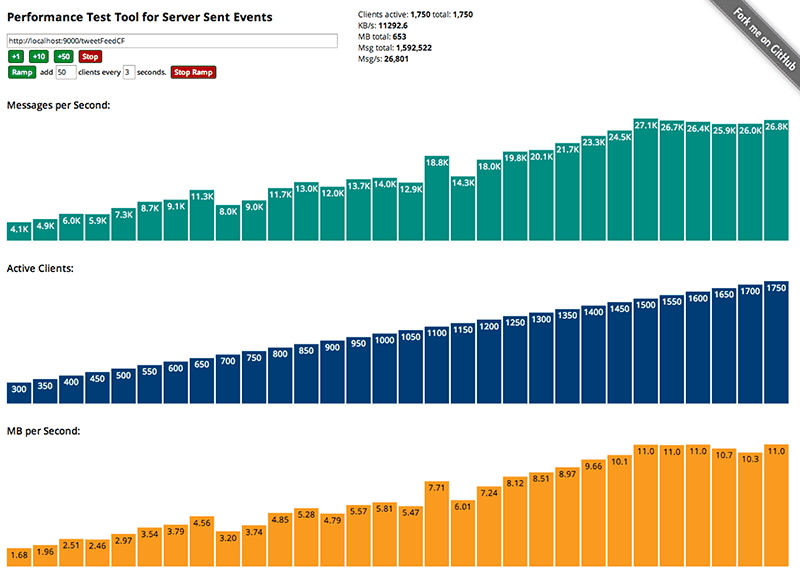
Creating the animated barchart is a little more involved. Let us start with something really simple today. Luckily I have a problem to solve that calls for a simple animation: sse-perf when running might or might not have have established connections hitting a server. If it does, it becomes immediately obvious that the connection to the sse-perf server is alive because the bars are animated. What if there are no client connections and thus there is nothing to report except zero values? I can have these zeros fly into the chart instead of the bars, but that looks really awful, I've tried it. But without anything moving, the connection looks dead. What do I do?
How about a visual heartbeat? Just a simple red dot that gets bigger when a new Server Sent Event is received and then shrinks to normal size again. This succeeds in convincing me that what I am looking at is still alive:
Let's implement that and drive it by a Server Sent Event stream. First of all, we need a div that will hold our animation which we can style and position by css however we like:
{% codeblock heartbeat div lang:html https://github.com/matthiasn/sse-perf/blob/f0feae4d2a82c136eb351d2a99e18b12f8e2f953/app/views/metrics.scala.html from metrics.scala.html%}
  <div id="heartbeat"></div>

  @helper.requireJs(core = routes.Assets.at("javascripts/require.js").url,
        module = routes.Assets.at("javascripts/main").url)
{% codeblock #heartbeat css lang:css https://github.com/matthiasn/sse-perf/blob/f0feae4d2a82c136eb351d2a99e18b12f8e2f953/public/stylesheets/main.css from main.css %}
#heartbeat {
    width: 20px;
    height: 20px;
    position: absolute;
    top: 18px;
    left: 530px;
}
Let us put all JavaScript in modules conforming to the require.js / AMD pattern. This prevents global namespace pollution, potentially loads faster and makes for a cleaner design. Play handles loading the JavaScript with require.js for us with @helper.requireJs.
The best thing with this approach is probably that Play will now run the closure compiler over our JavaScript code and show problems immediately by failing the build:

Sweet! Here are the excerpts of the JavaScript code that we need for the heartbeat. Full code is available on GitHub as usual.
{% codeblock main.js (require.js compatible) lang:javascript https://github.com/matthiasn/sse-perf/blob/f0feae4d2a82c136eb351d2a99e18b12f8e2f953/app/assets/javascripts/main.js from main.js%}
require(["barchart"], function (chart) {
  var heartbeat = d3.select("#heartbeat")
    .append("svg").attr("width", 20).attr("height", 20)
    .append("circle")
    .attr("cx", 10)
    .attr("cy", 10)
    .attr("r", 3)
    .attr("fill", "red");

  var feed = new EventSource("/metricsFeed");

  function handler(msg) {
    var data = JSON.parse(msg.data);
    heartbeat.transition().duration(700).attr("r", 7)
      .transition().duration(700).attr("r", 3)
      .transition().duration(700).attr("r", 6)
      .transition().duration(700).attr("r", 3);
  }
  feed.addEventListener("message", handler, false);
});
We draw the dot first. Using the global d3 object, we select our #heartbeat div, append an svg of size 20px by 20px, append a circle at x=10px, y=10px, give it a radius of 3px and fill it red. Thanks to method chaining, the D3 code almost reads like prose.
We then establish an EventSource("/metricsFeed") connection to the metrics feed and assign a handler function as an event listener to the "message" event. See the stream for yourself. We can use the handler function to trigger the animation.
Once again, the D3 code reads like a sentence: using the heartbeat object created above, we transition the radius from the initial 3px to 7px, to 3px, to 6px and back to 3px, all of these with a duration of 700ms each.
The stream I use as a trigger has data every 3 seconds. I found that it looks unhealthy if the heartbeat only animates 20 times a second, so I do the expansion / contraction cycle twice on each event. D3.js is great; it has a bit of a learning curve but it is well worth it because it will give you full control over everything you could possibly want to tweak on your page.
This is it for today, check back for more elaborate examples in the future. If you haven't already, how about you subscribe to the mailing list so you won't miss anything?
-Matthias