Matthias Nehlsen
Software, Data, and Stuff
Building an intelligent journal in Clojure, Part 1
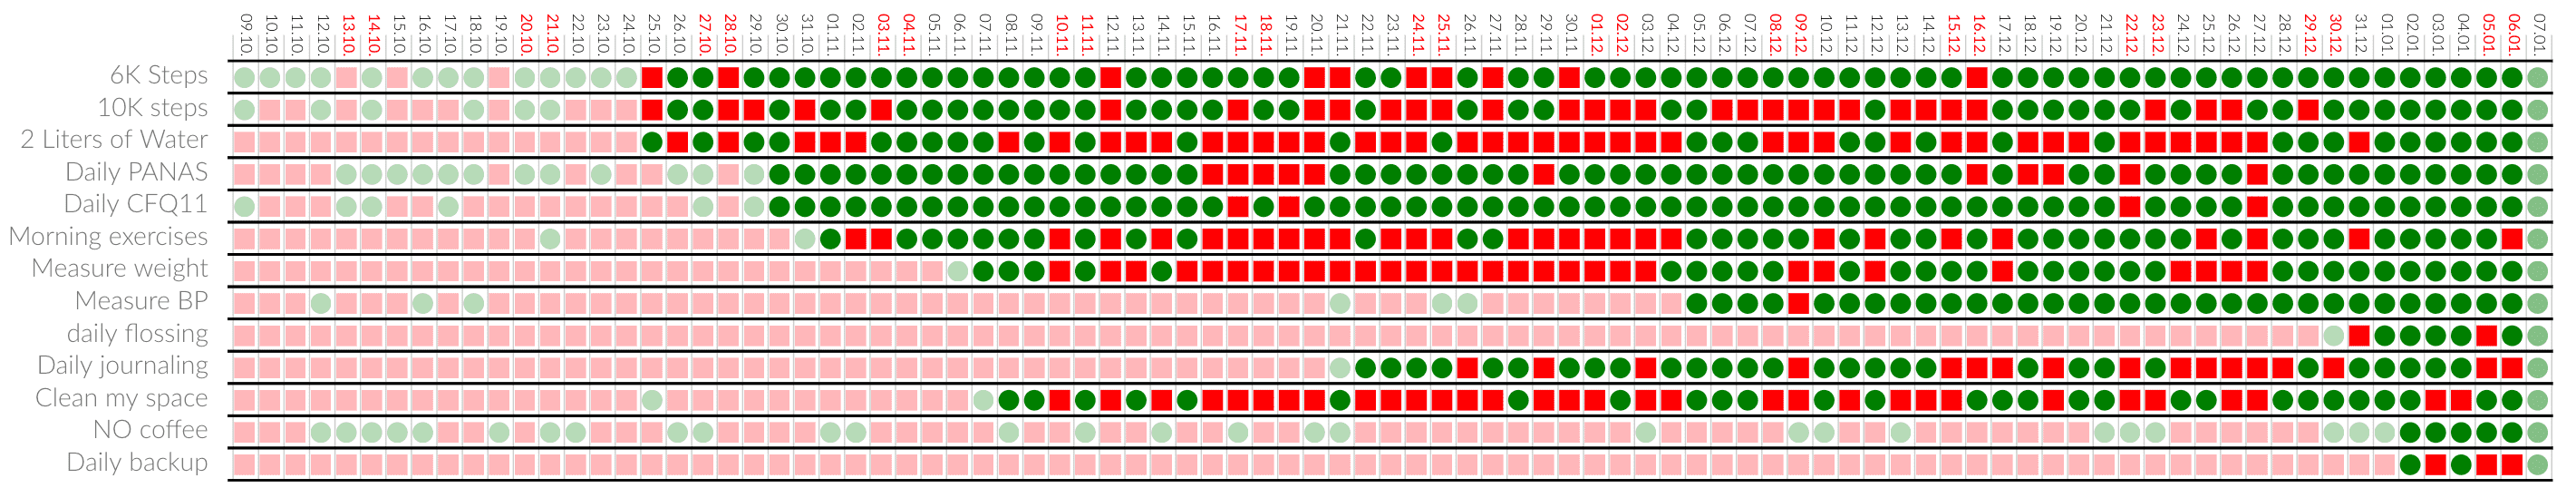
This is the first part of a series on how I built an intelligent journaling application that I use every single day - as a desktop application that is written in Clojure and ClojureScript. The description of the mobile app will follow. We got a lot to cover, so let's dive right in. I needed a tool that would help me get my life in order, and assist me getting the right things done, instead of just putting in a lot of hours barking up the wrong tree. That tool should also help me record the important things in my life, instead of solely relying on memory, which will be a bad bet in the long run. The tool needs to assist me in recording my life, while helping me decide what to focus on next. The tool should be helpful for other people, too, and very importantly not syphon their data off to a location outside their control, as it just does not get more private than keeping a comprehensive journal. You can read more about the motivation in this article. Data integrity was also an important consideration, especially since I did not want to rely on any cloud storage. Importantly, it should help me establish good habits, and reduce or eliminate bad habits, by defining and tracking them, and then showing where I succeed and where I fail, like this:
That application did not exist, so I built it in Clojure, which is my favorite programming language by far. It is currently called meins and I will describe its architecture in this series. In the process, I will show you a way to build a desktop application in Clojure and ClojureScript, with an Electron application for the UI, written in ClojureScript, and a JVM process doing typical backend work such as persistence and maintaining a searchable index, where the Electron application runs the JVM process in the background. You should be able to build any other desktop application in Clojure and ClojureScript using the same building blocks, with or without a JVM backend.
On the lowest level there is the systems-toolbox library. It lets you build larger systems out of communicating components, which are heavily inspired by the actor model, with one difference that actors here need not know where they send messages, but instead just place a message on a channel, completely oblivious of what happens going forward.1

Components also hold some managed state inside an atom. State changes will be broadcast as snapshots so that other components can observe the state. This is useful for example when rendering a user interface based on these snapshots.
Such actors or components then get wired together by the so-called switchboard, which is a component that instantiates components and connects them, all based on messages it receives. This could be more dynamic, but so far I am only using this mechanism when firing up a system. Then, a larger system will emerge when multiple such systems communicate, for example via Websockets and Node IPC here, or also Kafka or Redis (as a queue).
As such emerging systems become larger, I find it more and more difficult to build an appropriate mental model from code alone. I think that systems should assist me in my mental reasoning about them, beyond some logging, and some outdated, half-hearted design documents rotting in confluence. No, I'd rather look inside a running system and see what really happens, and build my mental model from what is, as opposed to my flawed beliefs about what the code might do.
You can find some of my ideas around observable systems in inspect, which visualizes a running system built with the systems-toolbox, and infers its structure through observing message flows. When activated, a system puts all messages it observes on the so called firehose, which can then be written to a file, or also put on a Kafka topic, or whatever else you want to write an adaptor for. In this case here, I use a simple append log, which inspect can then tail and examine independently.
This is meins, as seen by inspect, and only inferred from message flows and not at all from code or configuration:
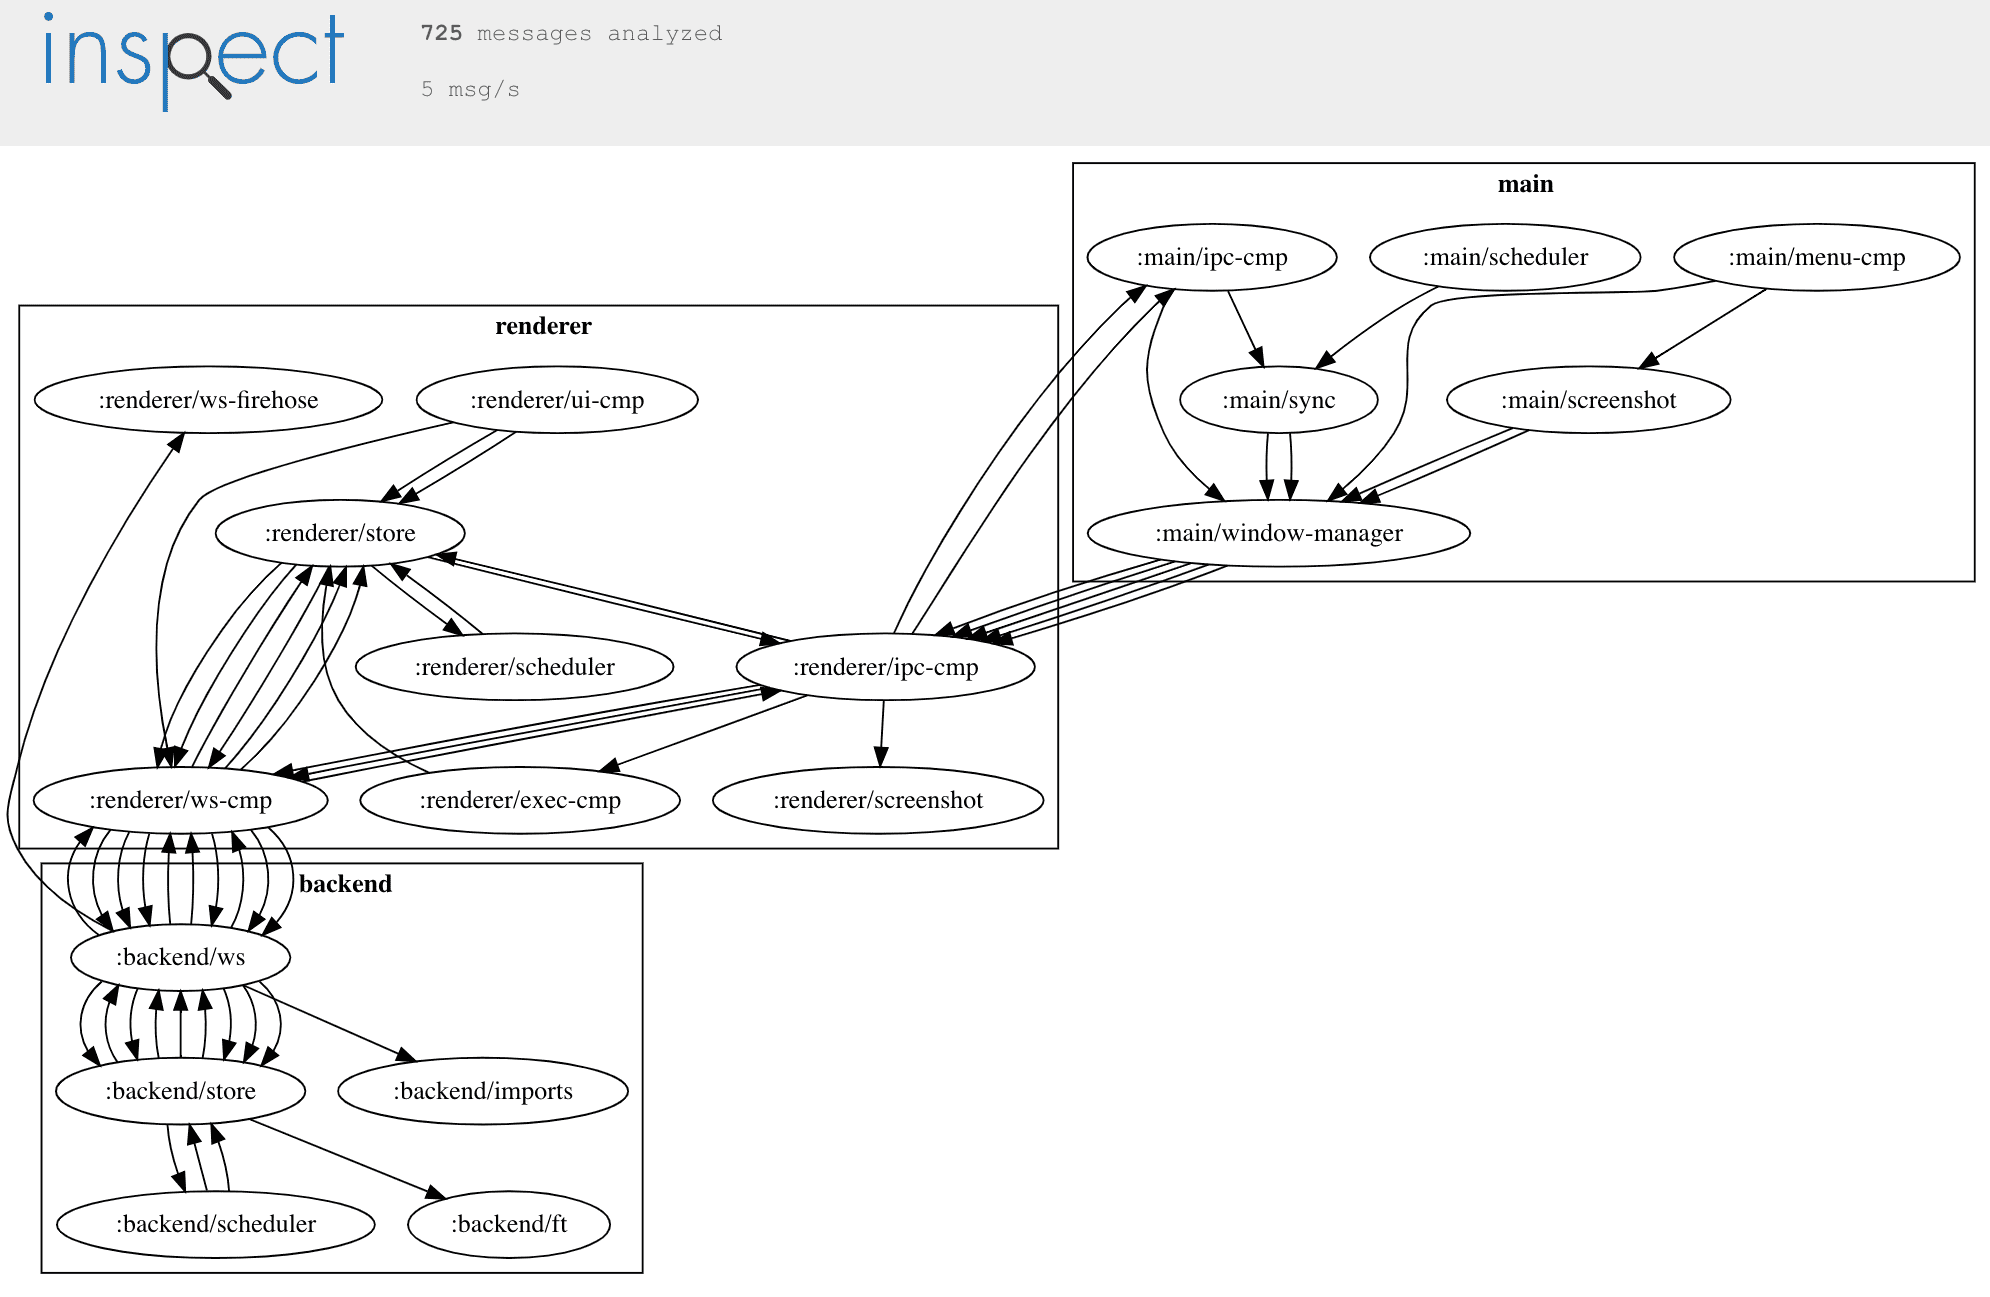
I'll show you how to use it later. For now, this automatically generated drawing provides a good starting point to dive into the architecture. There are three subsystems here.
On the bottom left, there is the backend subsystem. Most of the relevant logic in the backend resides in the :backend/store component, which persist each journal entry into an append log for each day. Just like any other component, the :backend/store component only processes a single message at a time and there is only a single store component, which guarantees that there is no chance of multiple threads writing to the same file at the same time, and corrupting it in the process. On application startup, the logs are simply replayed, as a complete rebuild in the Event Sourcing sense. Then, the :backend/store holds an in-memory index, modeled as a graph using ubergraph, which can be queried at runtime using GraphQL, where Lacinia provides the execution engine. This subsystem communicates with the renderer process using Websockets, provided by the systems-toolbox-sente library. The usage of Websockets or any other means of transport between components is transparent to the individual component. Components just put their messages on a conveyor belt and are done with their job.
In the middle, there is the renderer subsystem. This is a client-side ClojureScript application running inside an Electron renderer process, which is based on Chromium and behaves like a browser window, with some additional features. Here, the UI is rendered using reagent and re-frame. Communication between components is once again provided by the systems-toolbox library, and (non-UI) components look the exact same on the JVM and in ClojureScript. The user interface sends queries to the backend, both in GraphQL and as adhoc queries. These request messages are relayed to the backend using Websockets, once again using a component from the systems-toolbox-sente library.
On the right, there is the main subsystem, which is yet another ClojureScript application, this time running inside the Electron main process, which fires up both the backend and the renderer subsystems, and provides some platform interop such as providing the application menu or listening to key combinations. There's also a component for capturing screenshots. Communication between components in the renderer and the main process is provided by the systems-toolbox-electron library, which provides communication between processes that is similar to systems-toolbox-sente, except for the transport which is Node IPC instead of Websockets. Once again, components do not need to know any of this. There is some wiring between them and the communication component, and if the communication component is set up to relay a particular message type, it will do so.
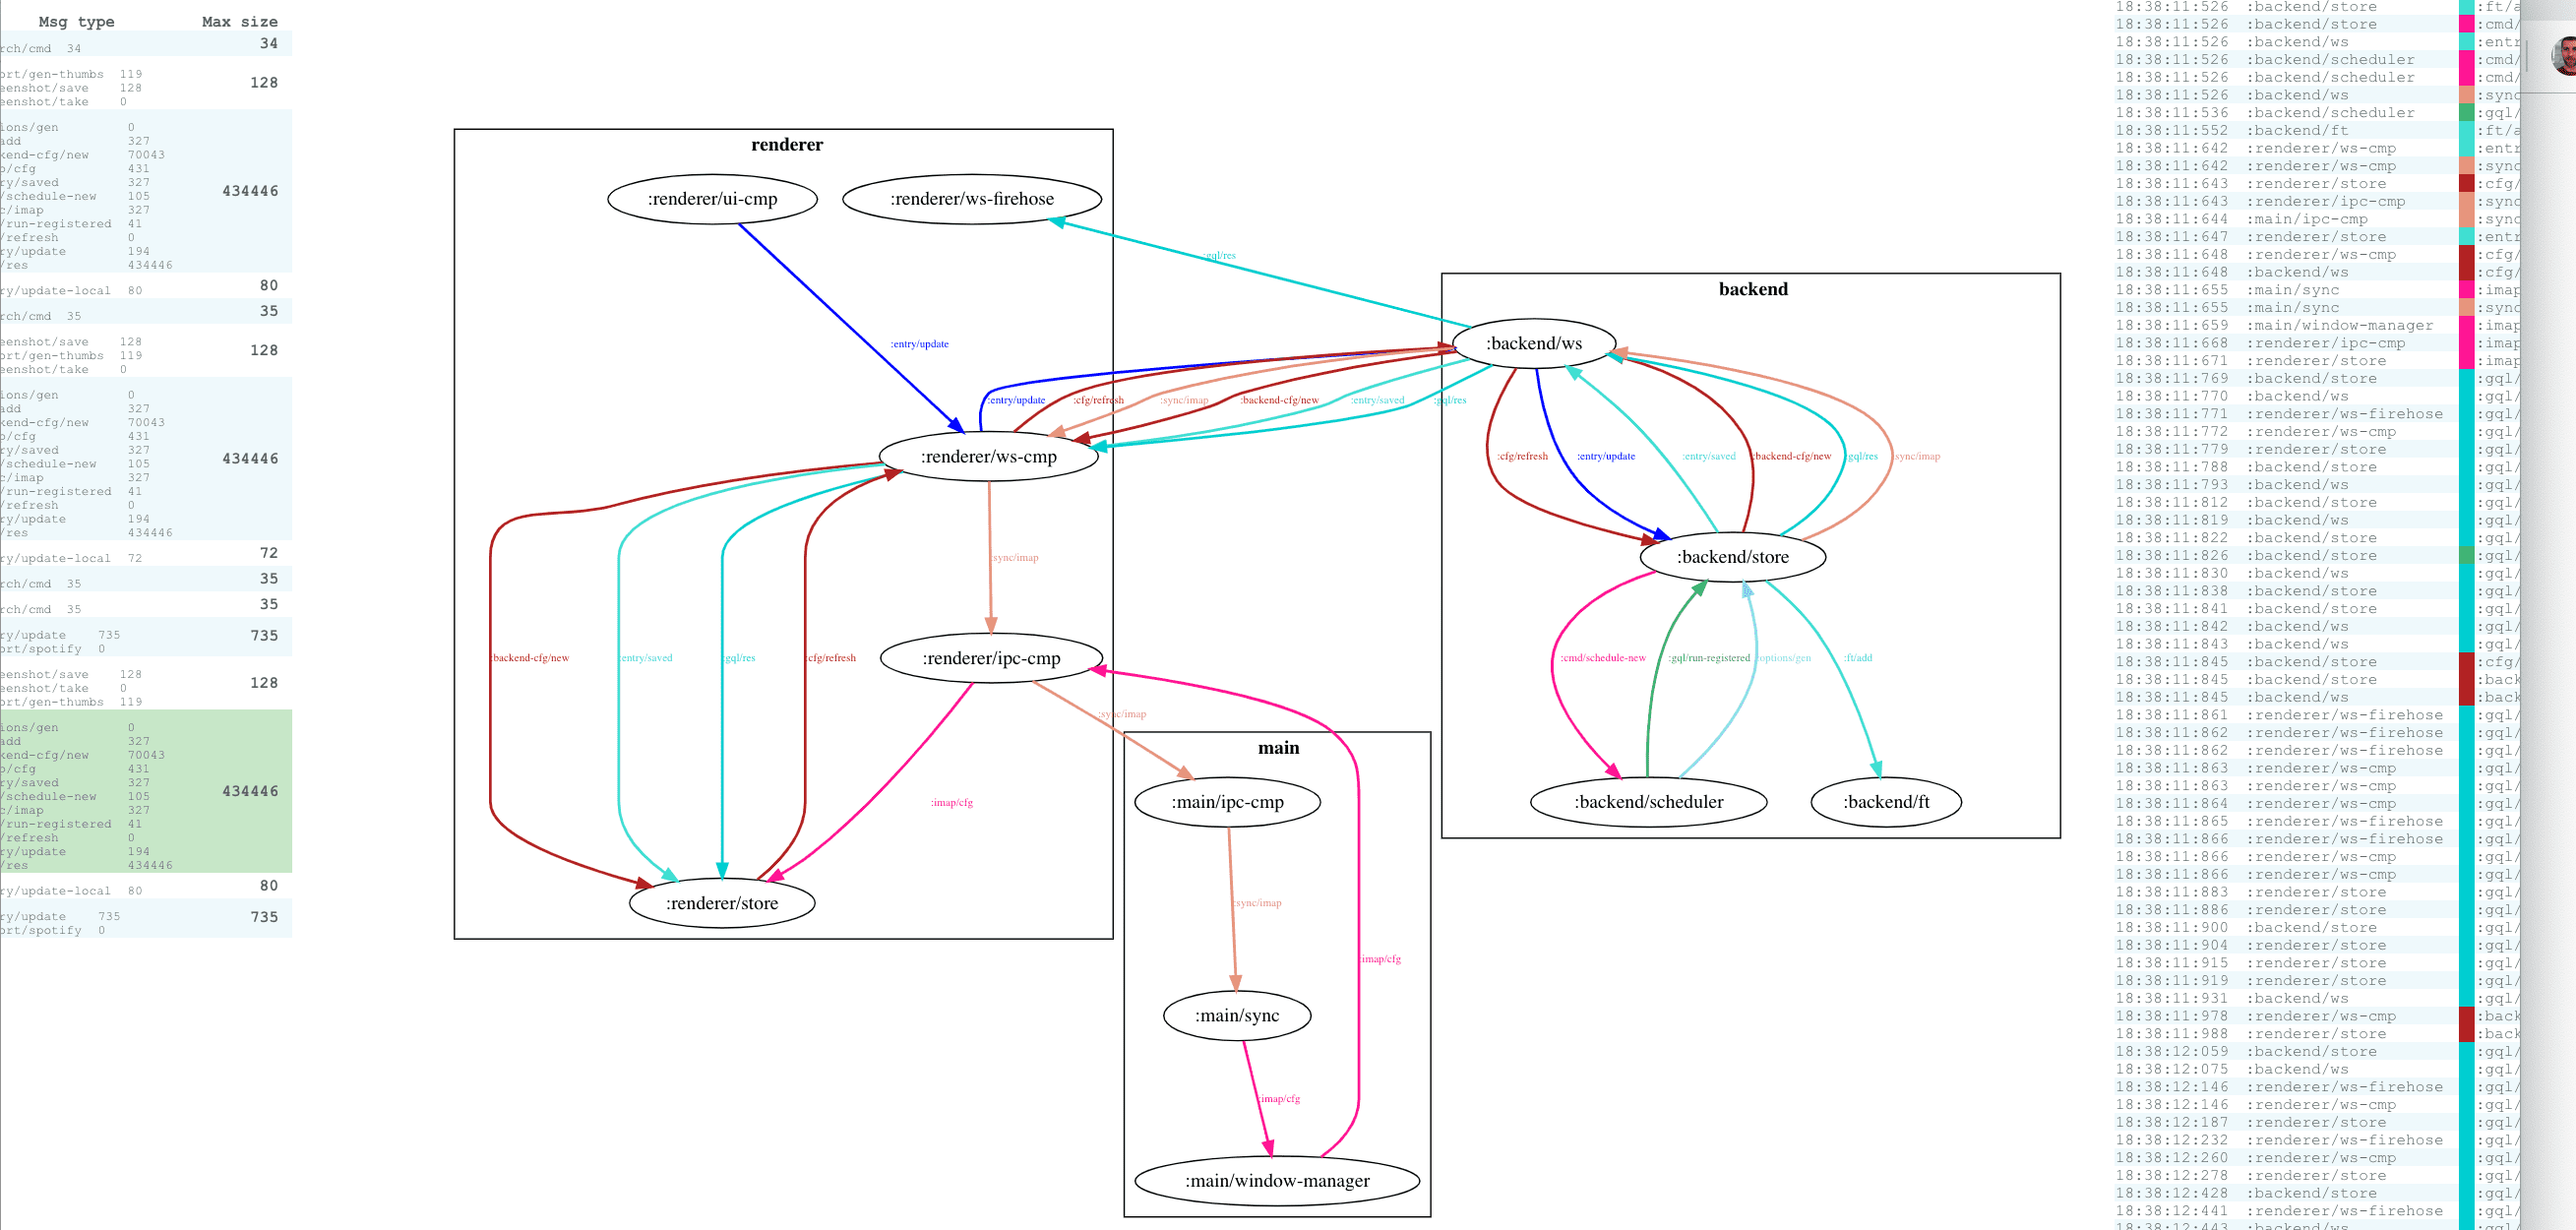
After this brief introduction, you already know enough to start exploring the system yourself. All you need to do is download meins, and then click Dev > Start Firehose in the menu. Then, download inspect and point it at /tmp/meins-firehose.fh using File > Open File, or on Windows. Go over to meins and click File > New Entry. Inspect will automatically cartograph the application, as it has seen it thus far. Then, you can examine the data further, e.g. highlight a particular message type:

Or, further on the right, you can select specific message flow, and see what other message types were involved, and how. Here's the message flow for all messages triggered by saving a journal entry:
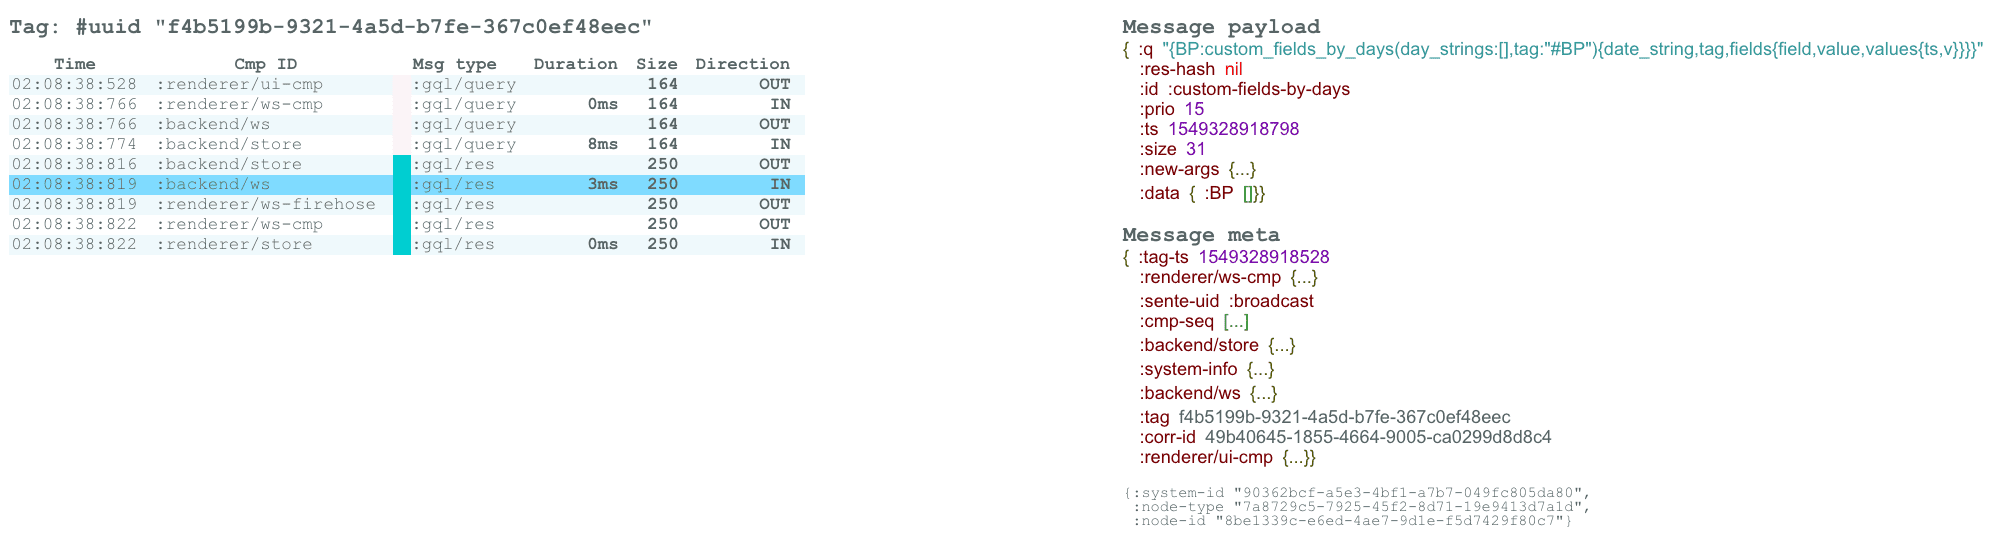
Next, there is a chronological list of all individual messages involved. To the right, you can look inside individual messages:
Overall, I find that such an interactive visualization quite helpful, not only when debugging message flows but also when trying to understand a system better in general. It's nice to have the system pitch in and document itself, as opposed to only having to rely on outdated documentation.
Please have a look at the manual for finding out what else meins can do. And if you're curious to find out what's going on under the hood, you can see all that play out in **inspect. In the next post, I will show you how all of this looks in code. If you're really curious, you can also have a look at the work in progress, or you can subscribe below and I'll let you know when it's out.
Thanks & until next time, Matthias
P.S. I'm looking for contributors. Please consider getting involved, or share this article to find people who can help. Thanks.
-
This is inspired by Rich Hickey's talk about core.async, and specifically the idea of conveyance.
↩